A common challenge in data science efforts is discussing how well a model is performing. Some big lessons we’ve learned in our client engagements is that understanding the measures of success and translating them into language SMEs and stakeholders can understand is absolutely vital to this kind of work. In this blog, I am going to look at three measures used to assess the efficacy of a classification model: accuracy, precision, and recall. Further, I will discuss how these measures have to be taken contextually; defining the success of a model can vary by industry, challenge, and how mission critical the decisions made by the model are. Again, these measures only apply to classification models (a model where a discrete conclusion is drawn given a set of data).
For the remainder of this blog I will use simple confusion matrices to illustrate my points. This matrix will consist of predicted “positives” and “negatives”, as well as actual “positives” and “negatives”. Before we begin, let’s look at an example.
Example: Predicting the Outcome of a Mortgage Application
In this example, let’s assume we use a training set of 10,000 historical mortgage applications. We’ve built and trained a model to predict when an application would be approved or not. We’ll use nice round numbers just for ease!
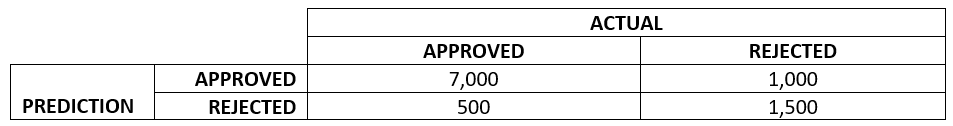
Of the four cells let’s use this terminology:
- True Positive: The model predicted the application would be approved and it was approved.
- True Negative: The model predicted the application would be rejected and it was rejected.
- False Positive: The model predicted the application would be approved, but it was rejected.
- False Negative: The model predicted the application would be rejected, but it was approved.
In this case, we can say the following with confidence: 8,500 applications were correctly predicted. 1,500 were not. Now, let’s break down the efficacy of the model by looking at accuracy, precision, and recall.
Accuracy is the most easily understood measure. It is quite simply the total number of true positives and true negatives divided by the entire data set. This is, of course, a very useful measure because it lets us know how well our model is performing overall.
The accuracy of this sample model is 85% (7,000 + 1,500 all divided by 10,000). Not bad, depending on the scenario; which we will discuss more in depth shortly.
Precision is simply a measure of true positives (positives our model identified) divided by all actual positives (both positives our model identified and those it missed).
In our example, that is 7,000 over 8,000 or 87.5%.
Before we talk about recall, let’s understand how these measures differ, and when you should care about one or the other.
If the cost of false positives is high, then precision is very important. In our mortgage application, false positives are certainly undesirable (We don’t want to lend to people who might not be able to keep up with the mortgage!) but might not spell doom for the organization. What if, however, our model was being utilized by a self-driving car and was attempting to predict when to apply emergency braking. False positives (ie braking when the situation is not actually warranted) could be extremely dangerous, or even fatal depending on the road conditions. Conversely, if our model was attempting to diagnose the recurrence of cancer, a false positive would only result in a more in-depth follow up from an oncologist.
Recall is the measure of true positives (positives our model identified) divided by true positives and false negatives (positives our model missed).
In our sample data that would be 7,000 over 7,500. which gives us a Recall of 0.933 or 93.3%
If the cost of false negatives is high, then Recall is very important. Again, in our mortgage application, false negatives are undesirable (We don’t want to miss out on a good borrower receiving a mortgage from us!) but potentially not catastrophic. But now let’s consider a model that detects micro-fissures in the casing of nuclear reactors. If our model predicts “There’s no fault, everything is fine!” when in fact there is (false negative), the outcome could be totally disastrous!
Recall and Precision are two very Important measures, and which one you should care more about varies from use case to use case.
F1 Score
I know this has been complicated enough, but a discussion on precision and recall would not be complete without mentioning F1 score. The F1 score is a function of both precision and recall and applies in situations where both false positives and false negatives are extremely important. I won’t go into the calculation here but know that it is a fourth evaluation criteria for certain applications.
In closing, evaluating a classification model is not quite as straightforward as one might think. It is worth the effort to think through exactly what your model is predicting and decide early how to measure your model in a meaningful way that is tailored to the use case. In cases of life and death, extreme care should be taken to ensure the model is erring on the side of caution, while using a model to recommend a product someone might want to buy can afford to cast a much wider net. I hope this look at how to evaluate a model has been helpful! Thanks for reading.
