
About Cody Halbleib
Cody Halbleib is a Senior Consultant on the Software team. His family is his partner, Jamie, and his Border Collie mix, Walter.
This site uses cookies to enhance your browsing experience and deliver personalized content. By continuing to use this site, you consent to our use of cookies.
COOKIE POLICY

Full distributed tracing and exception capture for any application — without writing a single line of instrumentation code.
View the source code on GitHub →
Observability is essential for understanding what’s happening inside your services, but instrumenting an application by hand — adding trace spans, logging calls, and metric counters throughout your codebase — is tedious and intrusive. What if you could get rich telemetry from an application that has zero logging or tracing code?
I built a small API with intentionally no logging, no tracing, and no OpenTelemetry dependencies in the code at all, then attached OpenTelemetry’s zero-code instrumentation at runtime. The result: full distributed traces, exception details, and HTTP metadata captured in Jaeger — all from a completely un-instrumented application. For this demo I chose Java and Spring Boot, but OBI supports a wide range of languages and frameworks — including .NET, Node.js, Python, Go, PHP, Ruby, and more.
OBI (OpenTelemetry eBPF Instrumentation) is a zero-code approach to observability that works at the kernel level using eBPF — a powerful Linux kernel technology that allows safe, sandboxed programs to run directly within the kernel at runtime without requiring changes to the kernel source code or loading kernel modules. Rather than requiring language-specific agents or SDK changes in your codebase, OBI hooks into system calls and network activity to automatically generate traces, metrics, and logs. Because it operates below the application layer, it works across languages and runtimes — your application code stays completely untouched.
The entire stack runs in Docker Compose with four services:
🌐 React App – Vite + Redux frontend on port 80
☕ API Service – Spring Boot + OBI agent on port 8080
📡 OTel Collector – Receives, batches & routes telemetry
🔍 Jaeger – Trace UI on port 16686
The React frontend calls the API, which is a plain REST service with two endpoints (/posts and /users) backed by simple in-memory data. Nothing fancy — and that’s the point. The application has no OpenTelemetry dependency in its own build file. All the magic happens at the infrastructure level. In this Java example, it’s a single line in the Dockerfile:
# Java example — download the OBI agent at build time
RUN curl -L -o opentelemetry-javaagent.jar \
https://github.com/open-telemetry/opentelemetry-java-instrumentation/releases/latest/download/opentelemetry-javaagent.jar

# Attach it at runtime — other languages have equivalent one-liners
ENTRYPOINT ["java", "-javaagent:/opentelemetry-javaagent.jar", "-jar", "/app.jar"]
A handful of environment variables handle the rest of the configuration — and these are the same regardless of language:
environment:- OTEL_SERVICE_NAME=obi-test-api
- OTEL_EXPORTER_OTLP_ENDPOINT=http://otel-collector:4318
- OTEL_METRICS_EXPORTER=otlp
- OTEL_LOGS_EXPORTER=otlp
The OpenTelemetry Collector sits between the API and Jaeger, receiving traces via OTLP, batching them, and forwarding to Jaeger’s native OTLP endpoint. Metrics and logs are currently routed to a debug exporter for visibility during development.
After running make up and hitting a few endpoints through the React app, the Jaeger UI immediately starts populating with trace data.
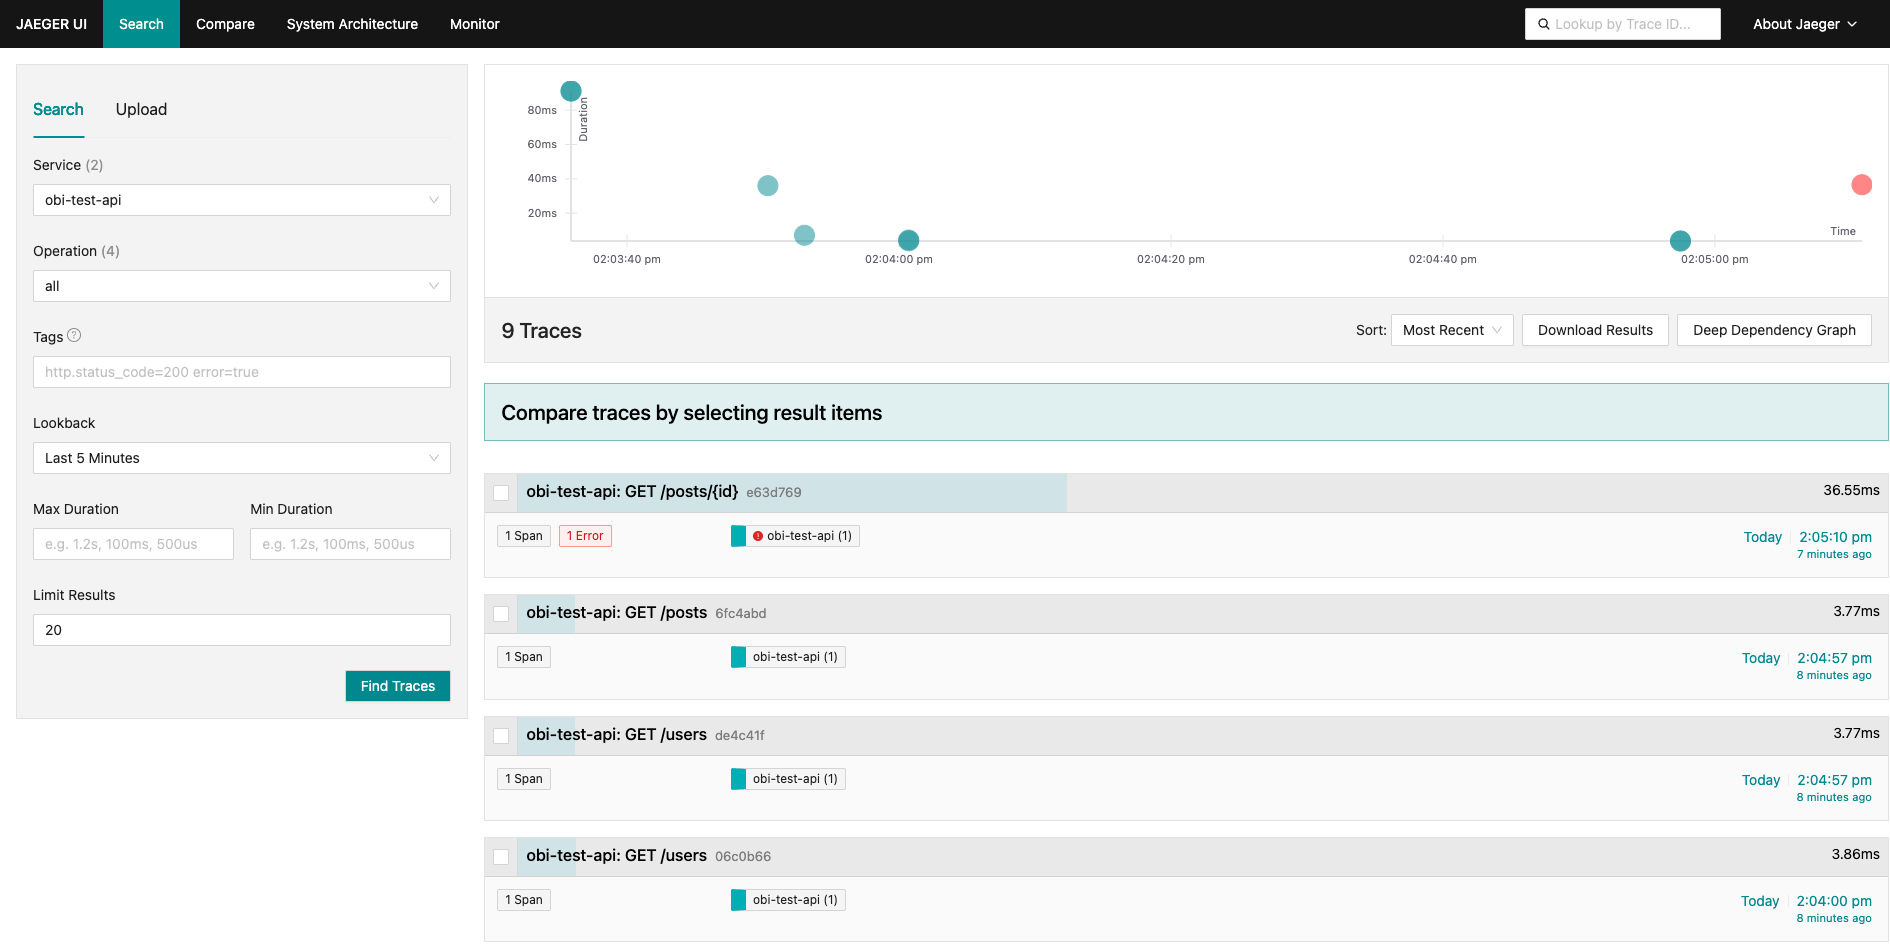
Jaeger’s search view showing 9 captured traces across GET /posts, GET /posts/{id}, and GET /users. The scatter plot shows response times at a glance, with one clear outlier containing an error.
Without writing any instrumentation code, the agent automatically captures:
HTTP request metadata — method, URL, status code, response time, and client IP for every request handled by the framework. Trace context propagation — each request gets a unique trace ID and span, ready for correlation across services. Error flagging — traces that result in exceptions are immediately tagged, making them easy to spot in the scatter plot and trace list.
The most impressive part is what happens when something goes wrong. In this demo, the GET /posts/{id} endpoint throws an exception when a post isn’t found. Here’s what that looks like in Jaeger, with zero catch-and-log code in the application:
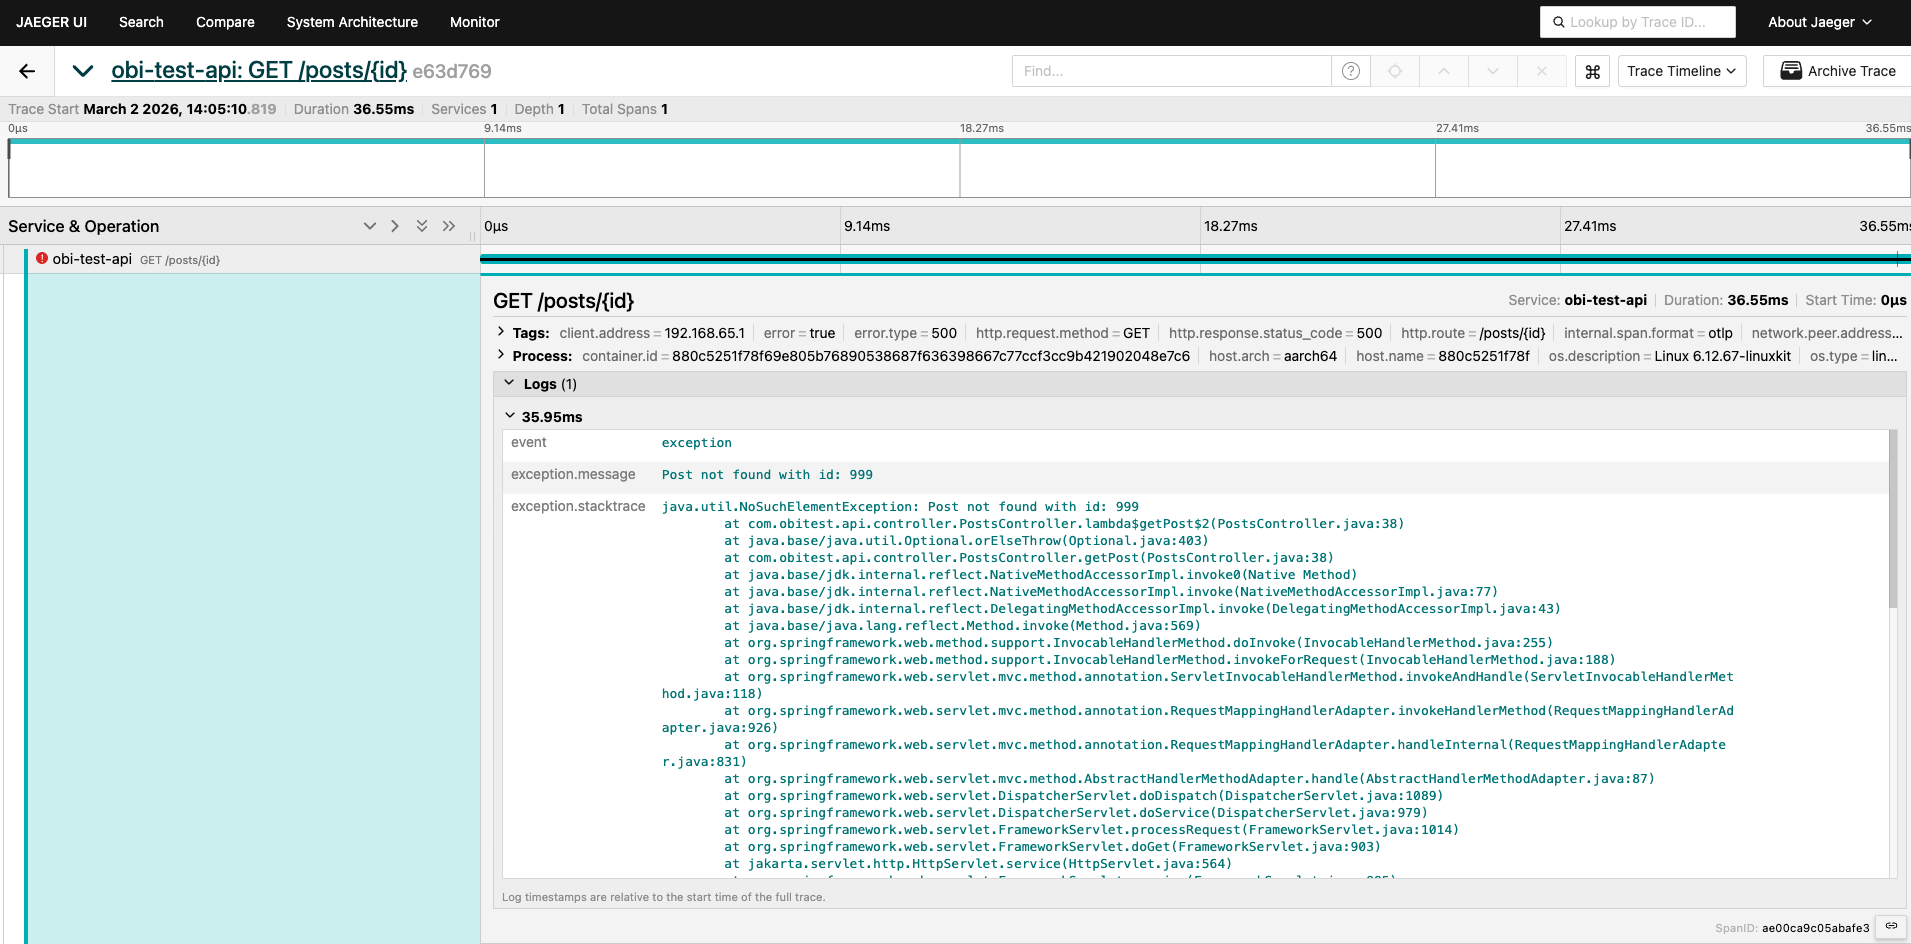
A detailed trace for a failed GET /posts/{id} request. OBI captures the full exception class, message, and complete stack trace — all without a single line of logging code in the application.
The trace shows the exception event with its full stack trace, the HTTP response status, request attributes, and timing — everything you’d normally need to hand-code with a logging framework and custom exception handlers. OBI intercepts it all at the framework level, and this works the same way whether your service is written in Java, Python, Node.js, or any other supported language.
No SDK dependencies, no annotations, no code changes. OBI attaches at runtime and instruments your framework automatically — in any supported language.
Unhandled exceptions are captured with full stack traces, making debugging straightforward even without structured logging in place.
Service name, exporter endpoint, and protocol are all configured through env vars — easy to toggle per environment with no rebuilds.
The OTel Collector decouples your app from your backend. Swap Jaeger for Datadog, Grafana Tempo, or any OTLP-compatible tool without touching the application.
Cody Halbleib is a Senior Consultant on the Software team. His family is his partner, Jamie, and his Border Collie mix, Walter.