
About Ben Frazier
Ben is a Senior Consultant on the Data team.
This site uses cookies to enhance your browsing experience and deliver personalized content. By continuing to use this site, you consent to our use of cookies.
COOKIE POLICY

Our recent exploration into generative analytics uncovered exciting possibilities for the future of business intelligence. We set out with a broad goal: to democratize analytics insights and eliminate bottlenecks by giving users a personal data analyst.
The result was GenBI, an internal proof of concept demonstrating how large language models can sit on top of structured datasets, translate natural language into SQL, and generate accurate charts in seconds.
Most BI tools still assume users know where data lives, how tables relate, or how to shape datasets before creating even the simplest visualization. In reality, the majority of business users know what they want: insight into trends, comparisons, or patterns but not how to retrieve or prepare that data.
Data teams, as a result, spend a disproportionate amount of their day fielding ad-hoc questions. Many of these questions are simple, repetitive, and ripe for automation. GenBI emerged as our internal experiment to challenge that dynamic. We wanted to explore whether anyone in the company could explore data instantly, without opening a BI tool or writing SQL, and whether insights could be generated in seconds rather than days.
This exploration aligns with broader shifts in analytics modernization: natural language interfaces, semantic layers, and LLM-assisted development. Data analytics is particularly well suited for natural-language interaction because non-technical employees often have a clear idea of the insight they need—just not the technical steps required to obtain it.
See a demo of what we built here.
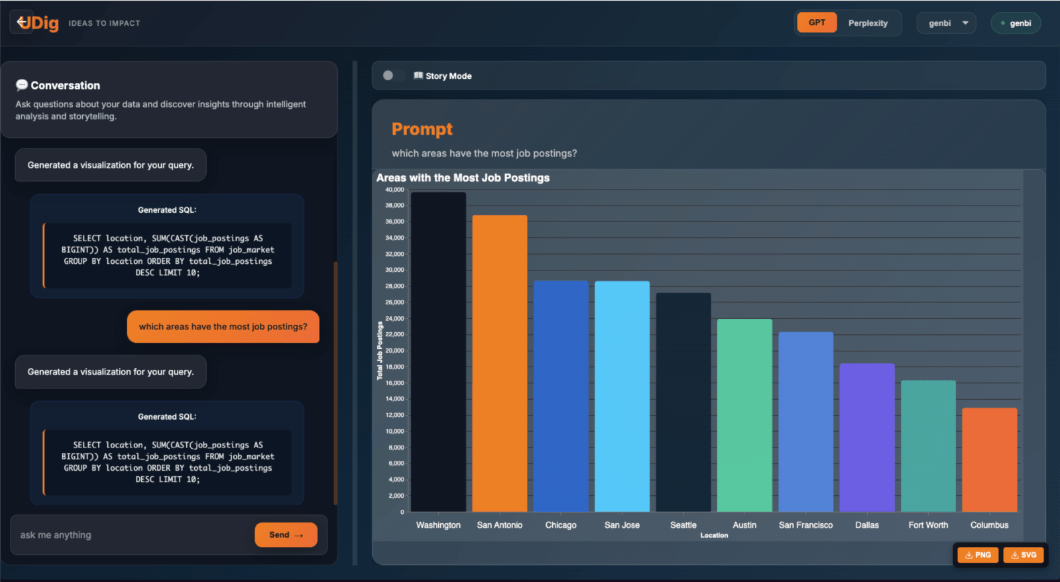
We designed the GenBI frontend to be fast, clean, and intuitive. Built using React/Next.js and Tailwind, the UI uses a two-panel layout that pairs a conversational interface on the left with visualizations and data previews on the right. This allows users to interact naturally while immediately seeing the results of their questions.
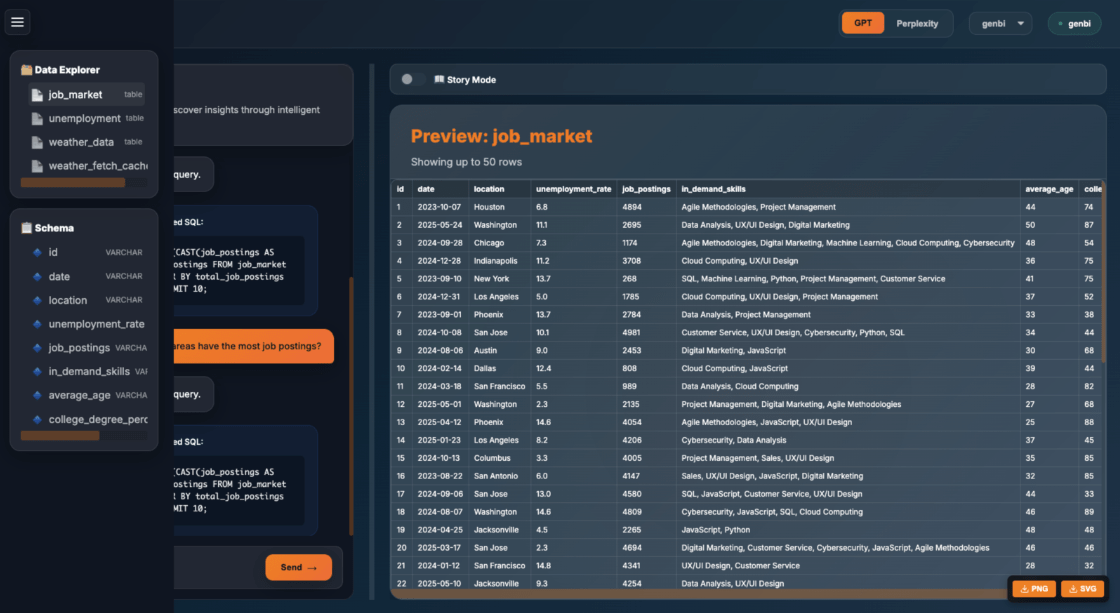
A ‘Data Explorer’ is available to provide users a reference for available data and schemas:
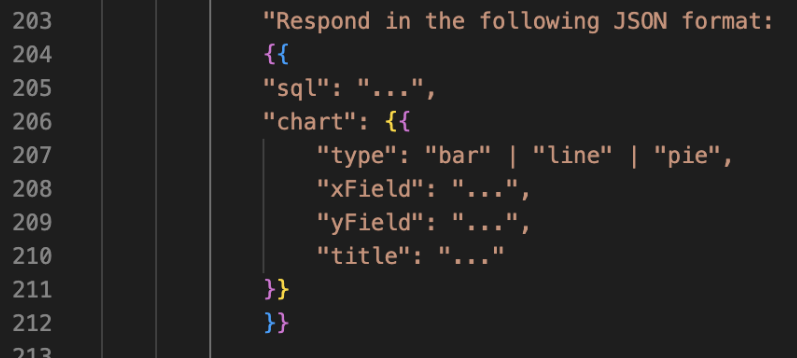
A key design decision was the use of Vega-Lite for visualization rendering. Vega-Lite’s declarative grammar made it ideal for an LLM-driven system: instead of generating code, the model only needs to output a structured JSON specification describing the chart:
The backend uses DuckDB as its analytical engine, chosen for its simple configuration and zero infrastructure footprint. DuckDB allowed us to run SQL queries directly against local datasets at high speed, which kept the feedback loop tight for experimentation.
Data ingestion was built as a modular pipeline, enabling new sample data CSVs or datasets to be added with minimal friction. The entire system is wrapped in Docker to ensure consistency across developer environments and eliminate “it works on my machine” issues.
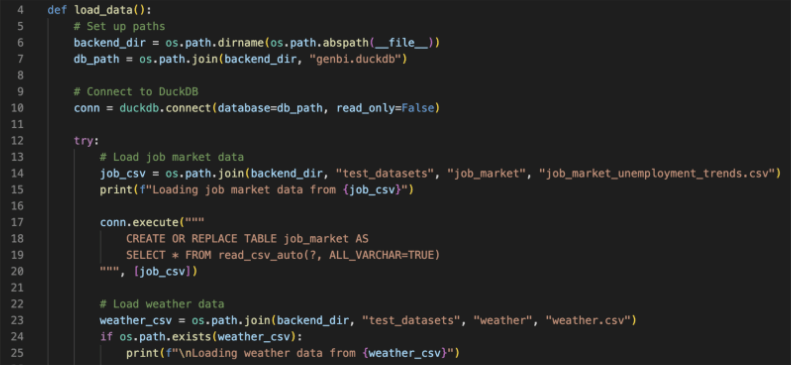
Snippet of the DuckDB sample data loader
Although this prototype uses local DuckDB files for convenience, the architecture is intentionally designed to be extensible. The same query-generation pipeline can be pointed to external systems—whether through ODBC, JDBC, warehouse connectors, or REST-based SQL interfaces. With only minor adjustments to the connection layer, GenBI could connect to Snowflake, Postgres, SQL Server, Fabric Lakehouse, or any enterprise data platform. This flexibility means the natural-language interface can sit on top of both lightweight demo datasets and real operational data with equal ease.
For the natural-language reasoning layer, we selected GPT models with future roadmap plans to allow for model selection by the user. Much of the system’s reliability comes from strict prompting patterns that guide the model to return SQL, visualization specs, and natural-language summaries in a predictable schema.
Throughout development, we experimented with temperature settings, response templates, and guardrails to ensure the model stayed grounded in the actual data rather than hallucinating fields or unsupported chart types.
We intentionally began with a small set of chart types, primarily line and bar charts, because they map cleanly to common business questions and are easy for the LLM to specify in a consistent Vega-Lite format. Line charts worked well for trends such as unemployment rates, while bar charts supported comparisons like job postings by location.
As the system matured, we explored more complex visual types. Tables and raw data previews were especially helpful for debugging and validation.
Future roadmap additions can cover things like scatterplots, maps, and multi-series charts to introduce more nuance along with additional guardrails. Early attempts to automate these often produced misaligned axes or overly complex specifications.
The success of GenBI hinges on thoughtful prompt engineering. The prompts tell the model how to behave, what format to use, what guardrails to follow, and how to remain grounded in the schema. We required the LLM to return a JSON object containing SQL, the Vega-Lite spec to force a deterministic contract between the model and the frontend.
One of the biggest challenges was balancing creative interpretation with structural correctness. Overly strict prompts caused the model to refuse legitimate queries; overly flexible prompts caused hallucinations or invalid field names. The structure of Vega-Lite helped here as well, giving the model a predictable format instead of requiring it to generate custom charting code.
LLMs are powerful, but they do not inherently understand your database. To help the model reason correctly, we constructed a “context prompt” describing the available tables, fields, formats, and relationships. This worked well but is ultimately static. The moment a dataset changes, the prompt becomes outdated.
A more robust system would allow the LLM to introspect the database dynamically and understand tables, fields, formats, and join keys on the fly. This moves the architecture closer to a true semantic layer and highlights the importance of strong data governance practices. Clean naming conventions and consistent structures significantly improve the model’s performance.
Many natural-language questions lead to charts that are technically valid but practically unusable. When someone asks, “How many job postings exist per city?” the model could generate a bar for every city in the dataset—sometimes tens of thousands.
To address this, we introduced rules instructing the model to limit results, and aggregate where necessary. Once implemented, chart readability and system usability improved dramatically.
GenBI demonstrates how close we are to a new class of analytics experiences—ones where natural language becomes the interface and insights appear instantly from structured data. Through this project, we confirmed that LLMs can reliably generate SQL, Vega-Lite provides a strong visualization layer, DuckDB offers exceptional performance, and prompt engineering is the connective tissue that makes everything work together.
Generative BI does not replace dashboards or analytics teams. Instead, it enhances them, reducing the volume of ad-hoc requests and giving business users a faster way to get the answers they need. Our next phase will focus on schema introspection, multi-dataset reasoning, and deeper integration with real enterprise data systems.
If your organization is exploring how natural language interfaces can reshape analytics, we’d be excited to share what we’ve learned or help you build something similar.
Ben is a Senior Consultant on the Data team.
Josh Narang is a Senior Consultant on the Data team.
